The Energy and Climate Change Division and Fortis Unum project collaborators presented 7 papers (listed below) at the 6th Africa Mini Grids Summit, held virtually between 25-26 February 2021 which brought together governments, regulators, utilities, investors, project developers, financiers, donor agencies and researchers.
Technology prospects in delivering electricity access Prof. AbuBakr Bahaj
Load Growth in Exisiting Mini Grids and Future Challenges Dr Luke Blunden
Productive Use of Electricity : Case Study PV powered Milk Cooling, Rwanda Dr Majbaul Alam
Modelling a Mini Grid Connected to the Utility Network to Enhance Network Resilience Daniel Nyandera, Kenya Power, Institute of Energy Studies and Research, Kenya
A Comparison of the Electricity Utilization of Three Rural Mini Grids in Kenya Using the Multi-Tier Framework Keren Kaberere & Samson Njoroge, Jomo Kenyatta University of Agriculture and Technology, Kenya.
Price Sensitivity Assessment of Mini Grid Electricity Consumers: Application of a Naïve Price Sensitivity Meter (PSM) Method Dr Al-Mas Sendegeya and Prossy Mutesi, Kyambogo University, Uganda
Appliance-Use Based Demand Modelling for Mini Grids in Kenya Using Demand Segregation Keren Kaberere & Samson Njoroge, Jomo Kenyatta University of Agriculture and Technology, Kenya.

Load Growth in Existing Mini Grids and Future Challenges
Dr Luke Blunden, Energy and Climate Change Division, University of Southampton, UK
PV-based mini-grids are inherently constrained in capacity due to the requirement for and expense of energy storage. If the demand for electricity in the mini-grid increases over time at a higher rate than expected, the strain on components may lead to early failure and expensive remedial work. On the other hand, if demand grows more slowly than expected, the revenue generated by the project may not cover its costs and a smaller system would have been more appropriate (Figure 1). In the first case, funds for remedial work and capacity upgrades may not be readily available years after the initial capital investment. In the second case, increasing the tariff or increasing the duration of the project may simply not be acceptable to funders, regulators or customers. Therefore, predicting the rate of demand growth is of critical importance in specifying the design of a PV-based mini-grid. However, there are few published studies on the rate of growth of demand. The work presented here introduces a simple model for demand growth in mini-grids. The model is compared with the values calculated for five mini-grids in East Africa. Although there are presently few data points, the agreement is promising and the model deserves to be tested on larger datasets as they become available.
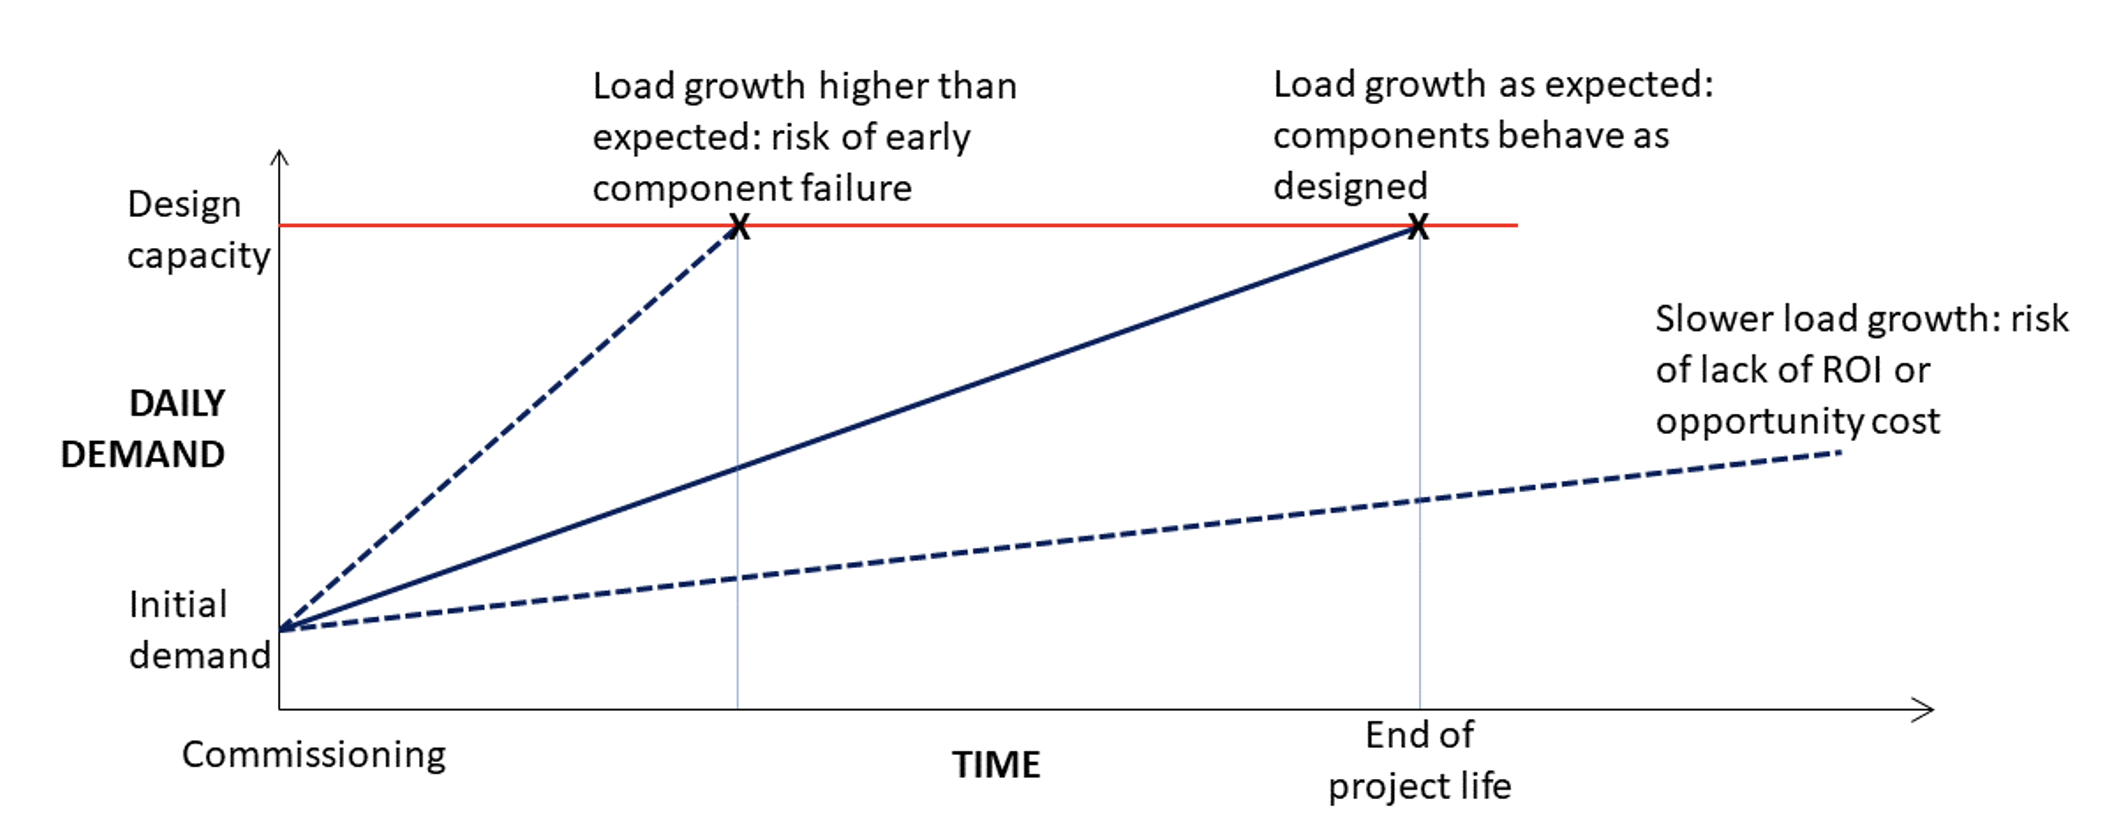
Figure 1 A simple model of demand grwoth in a mini grid
Productive Use of Electricity : PV powered Milk Cooling in Milk Centres in Rwanda
Dr Majbaul Alam, Energy and Climate Change Division, University of Southampton, UK
Globally about 789 million people have no access to electricity, most of which are in Sub-Saharan Africa and South Asia. Universal access to affordable and reliable electricity by 2030 (SDG7) remains a tough target. Decentralised solar mini grids along with Solar Home Systems (SHS) are considered as the most cost effective approach for off-grid electrification. Besides the purely domestic consumptions, electricity should be used for productive purposes to generate more income and hence climbing up the energy ladder. This research investigates how an agricultural anchor base load can be used to attain techno-economic sustainability for renewable energy technology while enhancing energy access in the local community as well as delivering socio-economic benefits through multiplier effects. Two existing off-grid milk collection centres (MCC) in Rwanda which are powered by diesel generators (DG) have been used as the case study to displace DGs with solar PV systems.
Our analysis based on the observed milk processing and energy consumption data collected from the selected MCCs indicate that appropriately designed PV systems can also support other community loads alongside the cooling loads. Four different combinations of daily electrical loads were considered and analysed which are, (i) cooling only (47.3kWh), (ii) cooling (47.3kWh) and hot water for wash (8.7kWh): total 56kWh, (iii) cooling (47.3kWh), hot water (8.7kWh) and smaller community load (5kWh): total 61kWh, and (iv) cooling (47.3kWh), hot water (8.7kWh) and bigger community load (14.5kWh): total 70.5kWh (Figure 2). Results show that with the bigger electrical load of 70.5kWh/d a PV-battery system comprised of 45kWp PV and 102kWh Li-ion battery delivers electricity at USD 0.24/kWh considering no capacity shortage compared to USD 0.68/kWh from diesel generator. This PV system also presents about 43,000kWh/y of excess or unused electricity. However, further analysis of the PV-battery system hybridisation with an occasional use diesel generator presents much better economic value and system resilience. The earlier mentioned bigger electrical load of 70.5kWh/d can be served with a hybrid system comprised of 30kWp PV, 70kWh Li-ion battery and 20kW diesel generator. This hybrid system has a lower CAPEX compared to the PV-battery system and delivers electricity at USD 0.18/kWh, and the generator only needs estimated 62 starts with 250 hours of runtime a year.
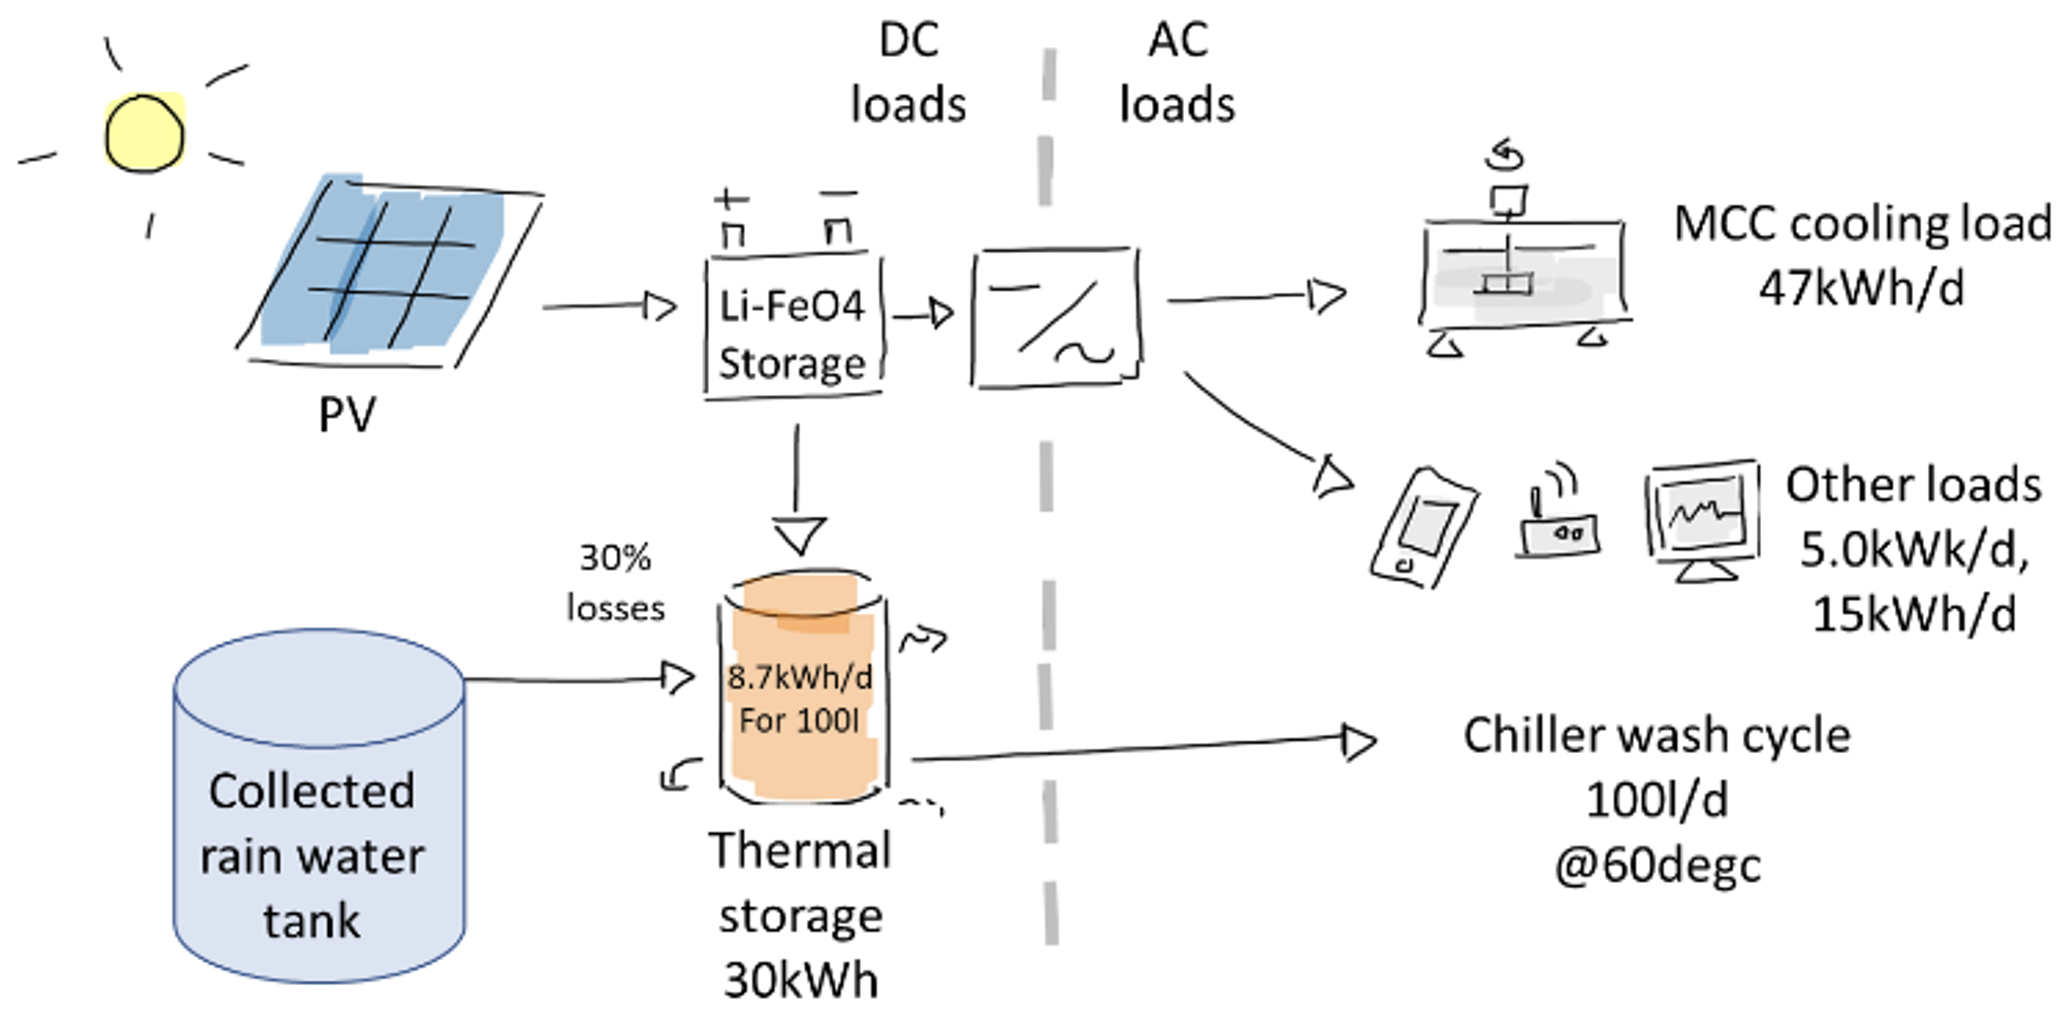
Figure 2 Different combinations of daily electrical load scenarios considered for analysis
Cheaper supply of electricity from the proposed PV-battery or the PV-hybrid system allow the milk collection cooperatives to save operational costs and thus opportunity for adding more value to local dairy value chain. This would help the local community to boost their income. We are working on a suitable business delivery model for transitioning of diesel powered MCCS to PV systems that can be used in all other off-grid sites in Rwanda as well as other neighbouring countries. We also understand that, to obtain the optimum socio-economic benefit of such electrification a holistic approach including micro-financing, training and supportive policy framework is needed.
Modelling a Mini Grid Connected to the Utility Network to Enhance Network Resilience
Daniel Nyandera, Kenya Power, Institute of Energy Studies and Research
Kitonyoni solar mini-grid was constructed in 2012 to supply electricity to a grid isolated rural village located in Wote, Makueni County. The mini-grid network directly links about sixty customers consisting of a dispensary, a school, business premises, and homes distributed around the rural village market area. Since its construction, the village has flourished economically with a myriad of activities and services presently being offered at the market center creating convenience to the larger village population. Recently, the power utility company also constructed a medium voltage power network within the vicinity of the mini-grid area. A robust design for interconnecting this mini-grid to the national grid network has been developed. The recommended architecture guarantees the resilience of the wider power network.
Technical analysis conducted to explore how the mini-grid could be effectively integrated into the national grid network focused on the scrutiny on the quality of power generated by the mini-grid to check conformity to the grid code requirements for integrating such small-scale renewable energy systems into the power distribution networks. Monitoring of the power parameters was done using data loggers. The developed interconnection architecture for this mini-grid was tested using power systems design and simulation software. Predictive analytic techniques were also employed to determine short-term power generation forecasts for the mini-grid.
The mini-grid network has a surplus generation capacity which can be exported to the national grid. The power parameters measured from the mini-grid network and those derived from the simulation were within acceptable limits for grid integration into the power distribution network as outlined in the grid code.

Figure 3 Grid meets the mini-grid: a 13.5 KWp mini-grid is being connected to the MV network at Kitonyoni market
A Comparison of the Electricity Utilization of Three Rural Mini Grids in Kenya Using the Multi-Tier Framework
Keren Kaberere & Samson Njoroge, Jomo Kenyatta University of Agriculture and Technology, Kenya.
Kenya has an electrification rate of 75% mainly driven by the Last Mile Connectivity Program of the main distribution utility, Kenya Power. Many rural communities are served through standalone Solar Home Systems and solar mini grids. Under the Energy for Development (e4D) program, three mini grids were established in Kenya; Kitonyoni in 2012 and Oloika and Shompole in 2015. World Bank’s Multi-Tier Framework describes the level of access to electricity in five tiers linked to the type of appliances used by the electricity consumers, level of service derived from the appliances as well as their energy consumption level.
In this study, a comparison was made of the electricity utilization by the consumers in the three e4D mini grids during a typical weekday, based on an energy segregation model from appliances in use. The data used was based on surveys of different classes of consumers. A comparison was then done of the 3 different criteria of evaluating the level of energy access across the 3 mini grids using the Multi-Tier Framework. Customer surveys were in each sites to establish the type of appliances in use as well as the period of use. The load profiles of individual customers were developed and used to classify the customers across the 5 Tiers based on their appliances use. A breakdown of the surveyed customers is given in Table 1 for each mini grid.
Table 1 Customers Interviewed
|
Mini Grid |
Active Customers | Customers Interviewed | Customers Interviewed (%) |
| Kitonyoni | 39 | 22 | 56.4 % |
| Oloika | 63 | 28 | 44.4 % |
| Shompole | 29 | 15 | 51.7 % |
From each customer’s classification under each criteria, an aggregate tier classification was calculated based on their lowest score under the three criteria. The distribution of the customers in each mini grid was obtained. A comparison of the percentage distribution of customers across the 3 mini grids taking into consideration the number of customers interviewed as well as total customers active in each mini grid is shown in Figure 4.
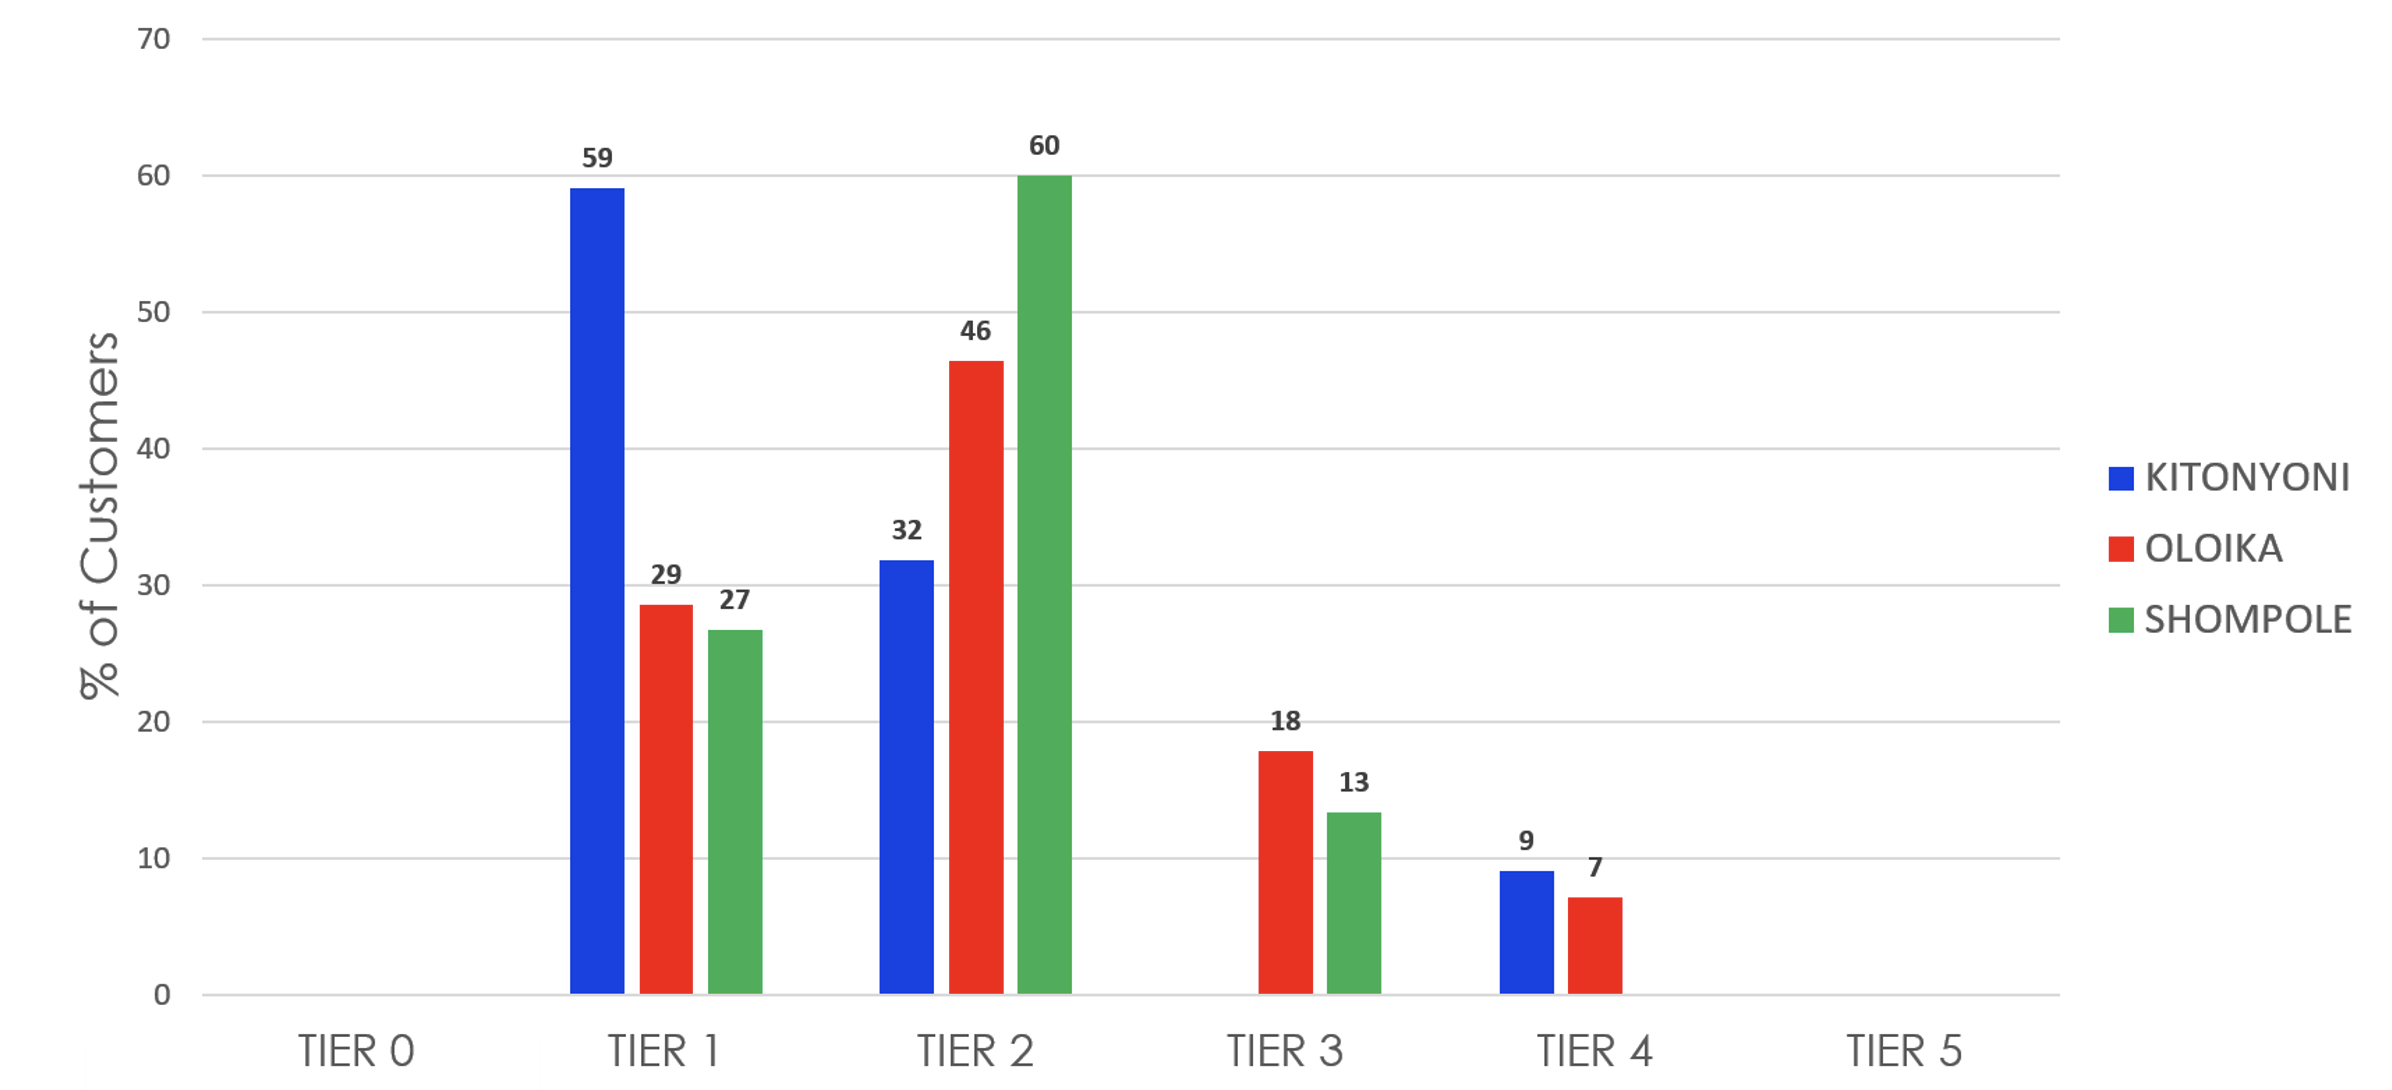
Figure 4 Aggregate MTF Classification for E4D Mini Grids
Kitonyoni mini grid has 59% of the customers in Tier 1 while Shompole has 60% in Tier 2. Oloika mini grid has 71% of customers in Tier 2 and above. Overall, Oloika Mini grid has the highest overall level of access with an overall score of 41% access level with Shompole second at 37% and Kitonyoni third at 32% access.
Price Sensitivity Assessment of Mini Grid Electricity Consumers: Application of a Naïve Price Sensitivity Meter (PSM) Method
Dr Al-Mas Sendegeya & Prossy Mutesi, Kyambogo University, Uganda.
Continuous rural electrification in the developing nations requires setting socially acceptable and affordable electricity tariffs without compromising economic sustainability of the systems. However, most of the consumers change their consumption in response to changes in prices. Understanding the way electricity users respond to tariff/price changes is vital for utilities and regulators. Therefore, it is the responsibility of the system operators to understand the way customers respond to price changes. Quantitative assessment of price sensitivity of newly connected electricity consumers may be challenging due to lack of long-term historical data. This research illustrates the application of price sensitivity measurement (PSM) method to analyse electricity consumers’ tariff perceptions, attitudes and acceptance to tariff changes. Hence, the consumers’ willingness to pay and price sensitivity are evaluated qualitatively.
The Price Sensitivity Measurement (PSM) methodology was developed by a Dutch economist Peter Van Westendorp. The theory is based on four questions which are related to the respondents’ expectation and to check their perception whether to consider the product in four categories: too expensive, too inexpensive, expensive and inexpensive. The method is implemented graphically by showing curves created from the plot of cumulative distributions.
The method is widely used by marketers and researchers to assess customers’ price sensitivity. The paper assesses consumers’ tariff perceptions, attitude to tariff changes and general acceptance of tariffs. The assessment is based on field survey data obtained from low demand consumers (households and small businesses) in a case study rural community using solar photovoltaic mini-grid in western Uganda. The results indicate that the tariff currently offered is within the range of tariffs possibly expected and likely to be accepted by consumers, and close to the tariffs which consumers consider to be worthy. Though the PSM is a naïve methodology, the information obtained can be used by power system operators to make a preliminary assessment of consumers’ expectations and/or acceptance levels of a certain range of tariffs during tariff review.
The results from the PSM analysis can be used to estimate the possible range of tariffs where consumers are likely to reject using electricity. The measure of stress can guide in assessing consumers’ price sensitivity and to investigate the possibility of using tariff as a variable for classifying consumers, e.g. into high- and low-tariff segments.
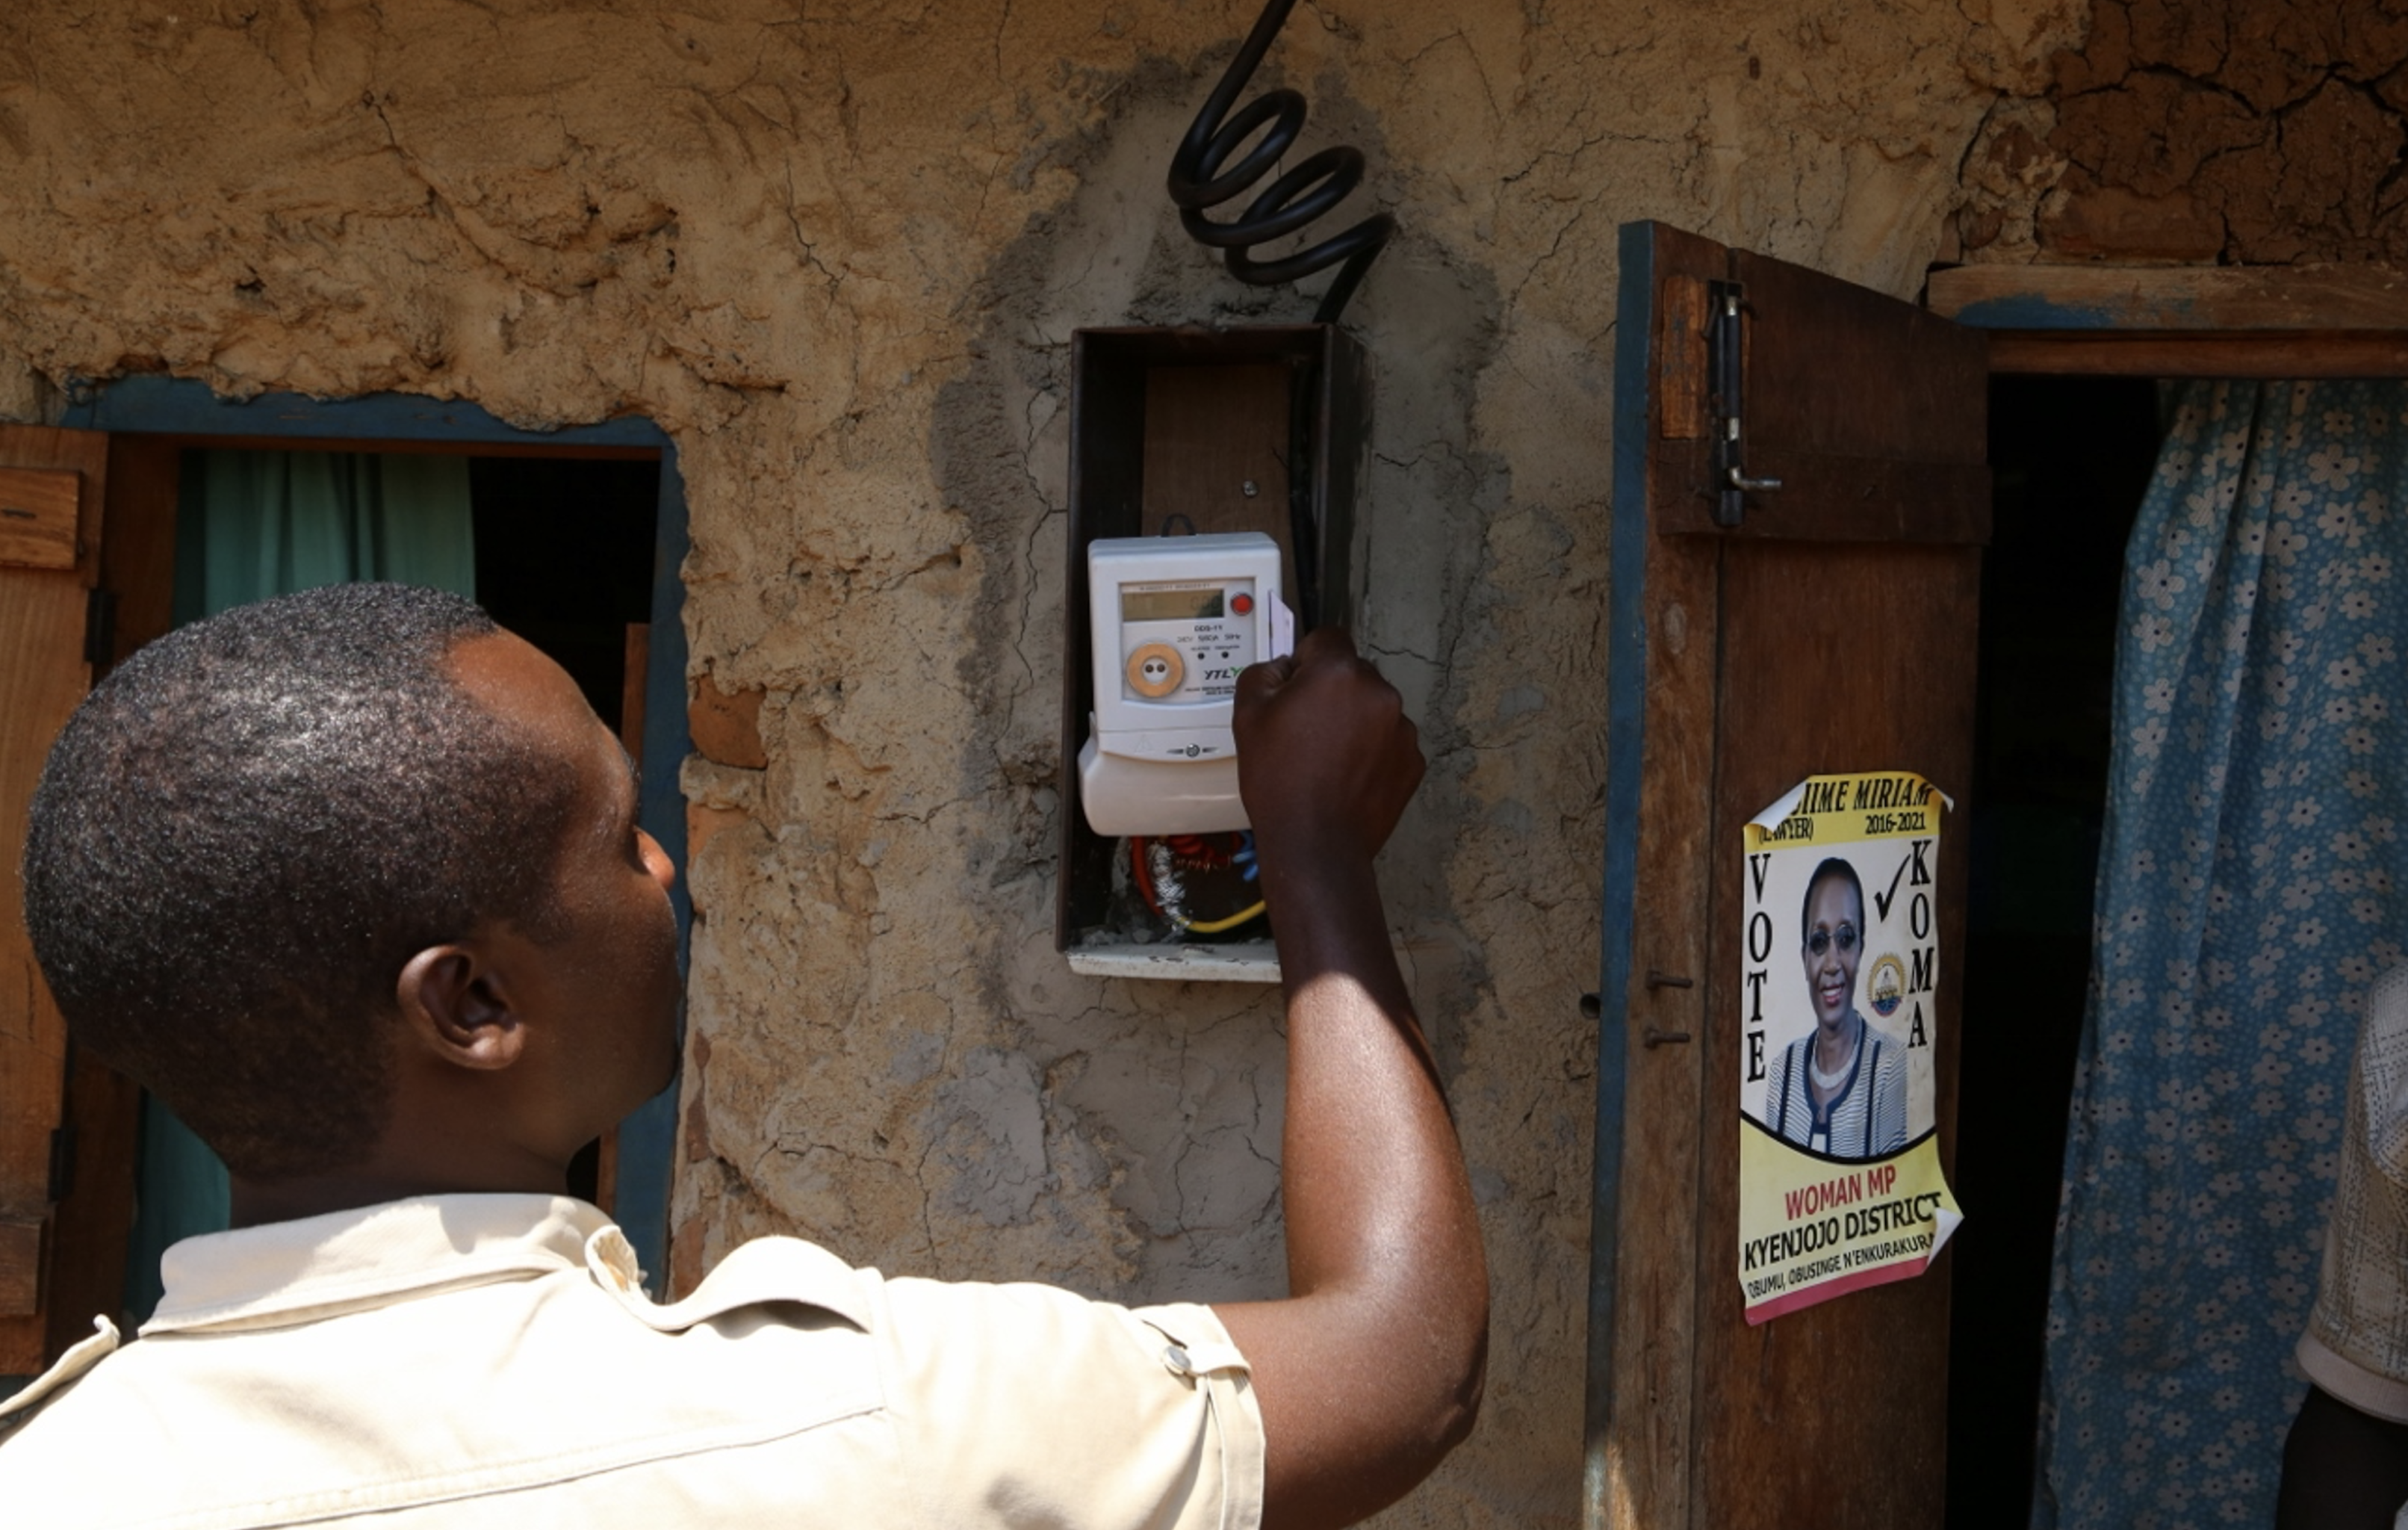
Figure 5 Topping up a prepayment meter at a mini-grid in Kyenjojo District, Uganda jointly developed by ECCD and REA Uganda
Appliance-Use Based Demand Modelling for Mini Grids in Kenya Using Demand Segregation
Keren Kaberere & Samson Njoroge, Jomo Kenyatta University of Agriculture and Technology, Kenya.
Load modelling is one of the challenging aspects in mini grid design, and it affects the tariff setting process within the mini grid. Prior to implement a mini grid project, it is imperative to model future demand based on current demand trends for expansion purposes or in the case of a need for tariff adjustment. While modern smart grid technologies provide an easy solution to the monitoring of individual consumers by using Non Invasive Load Monitoring (NILM) devices, rural mini grids present a challenge since the costs associated with installing smart meters for each individual consumer within a mini grid would exceed the actual energy cost borne by the consumer.
In this study, an appliance based demand disaggregation approach was adopted to model individual customer demand based on appliance time of use for 3 customers (a Pub, General Shop and Tailoring Shop) within Kitonyoni mini grid. The demand model was constructed based on individual consumer surveys conducted in February 2019 in Kitonyoni mini grid. Validation of the customers’ demand models was done by monitoring the load profile of the 3 individual customers for a two-week period in May – June 2019 using a novel load monitoring device developed by the University of Southampton. A comparison was then made of the modelled demand versus the logged demand from the monitoring devices (Figure 6).

Figure 6 Pub Demand Model (left) Shop Demand Model (centre) Tailoring Shop Demand Model (right)
While the error in the Pub and Shop models was relatively small, the substantial error in the tailoring shop arose from the unique use pattern of an iron box, a relatively high power appliance. Future studies to generate appliance archetypes should take this into consideration and generate appropriate Demand Factors for large loads.