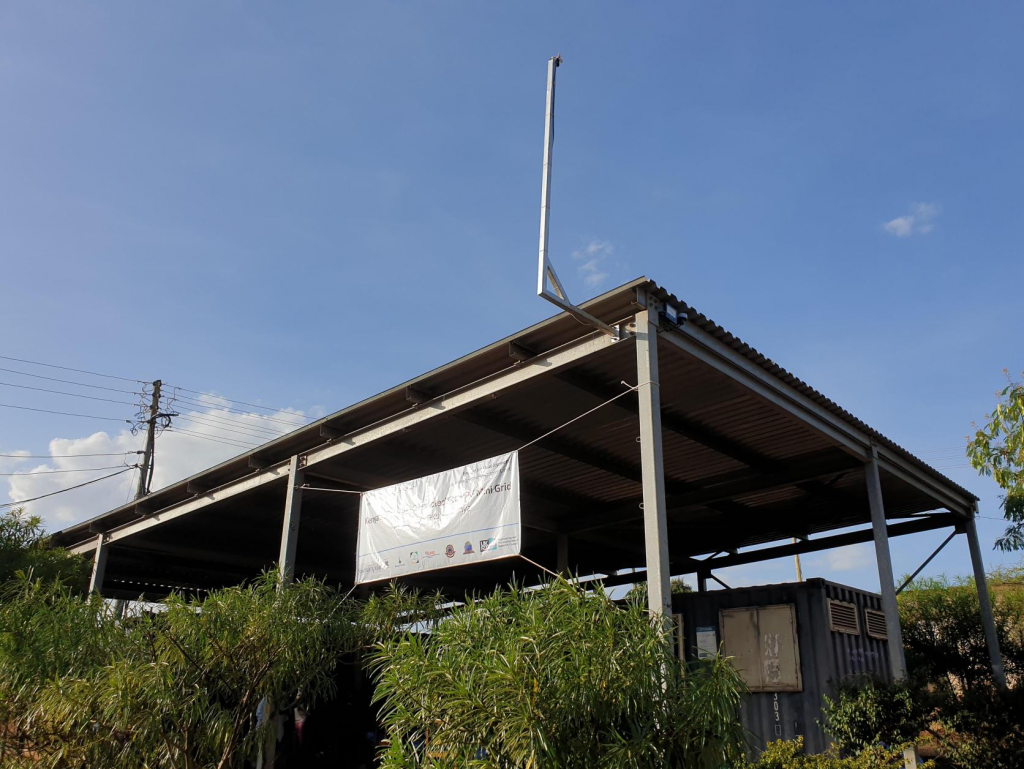
Kitonyoni Mini-grid: operational data
Mini-grid voltages
Auto-updates every 2 minutes – hover cursor over graph to see individual values. Click and drag to zoom in, or use controls in top right corner of graph. Time displayed is specific to your device; the local time at Kitonyoni is GMT+3 hours.
The welding shop was connected to the mini-grid on 23 December 2022. Prior to this date, the welding shop was connected directly to the grid. Grid outages and brownouts can be identified by periods of stable 230 V produced by the inverters, as opposed the variable voltages experienced while operating in grid-connected mode.
Power use by mini-grid customers
Graphs update every two minutes. Power is in W (real/active power). Note for rendering performance purposes, data points are sampled as the graph zooms out, so please zoom in on peaks in power consumption in order to see the true peak values. You can either click and drag on the region of interest, or use the controls in the top right hand of the graph window.
Welding shop and café

Shop close to transformer

Co-operative office (close to plant room)

Tailoring shop

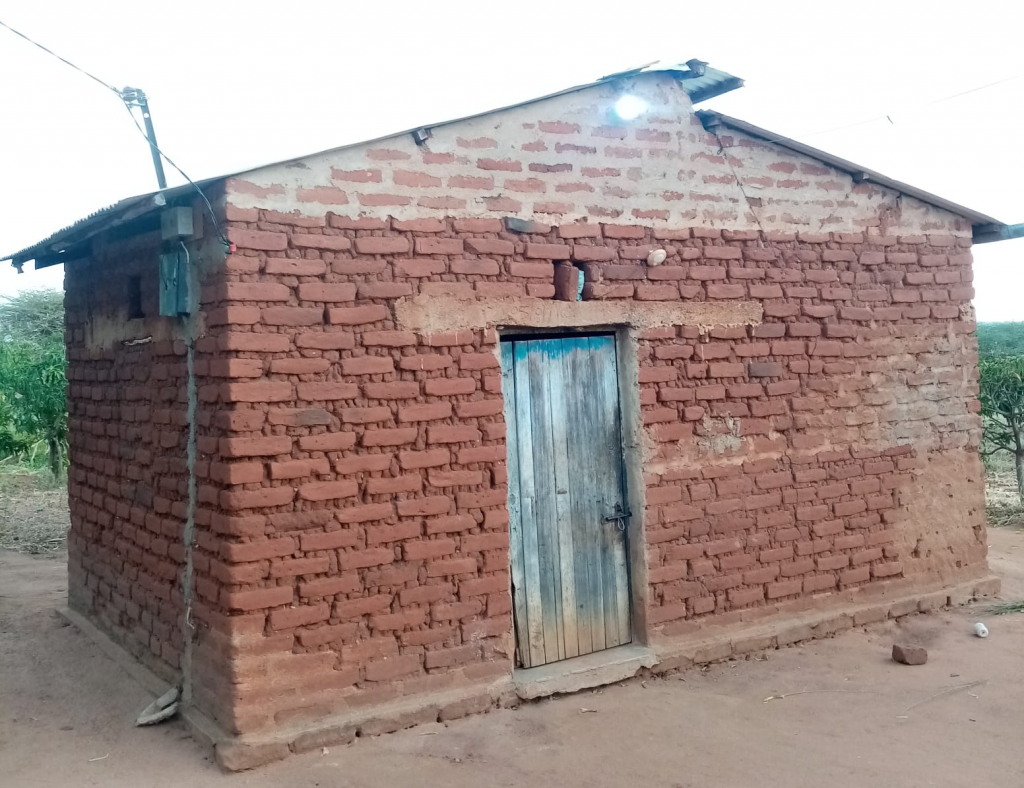
Homestead at southern end of mini-grid

