Author: Ben Anderson (b.anderson@soton.ac.uk, @dataknut)
We recently posted a brief analysis of household power demand during the May 2018 Royal Wedding which showed a number of surges and dips associated with events in Windsor. In this post we switch to events in Russia – and specifically the first England game of World Cup 2018 (vs Tunisia). Are similar patterns visible?
As before, this analysis uses a stratified random sample of several thousand households from the County of Hampshire, the Isle of Wight and the Cities of Southampton and Portsmouth who are taking part in a large-scale study of energy demand. This sample is representative of these areas but possibly not of the wider UK population and we have been collecting 10 second power demand data from these households since late 2016.
Just another weekday?
As with the previous posts, we extracted and aggregated the 10 second power demand data to give mean kW demand over each 1 minute and 5 minute period for Monday 18th June 2018. This gives the plot shown below right which also has 95% confidence intervals for the mean kW. These confidence intervals tell us several things, including how much variation there is between households at each time point.
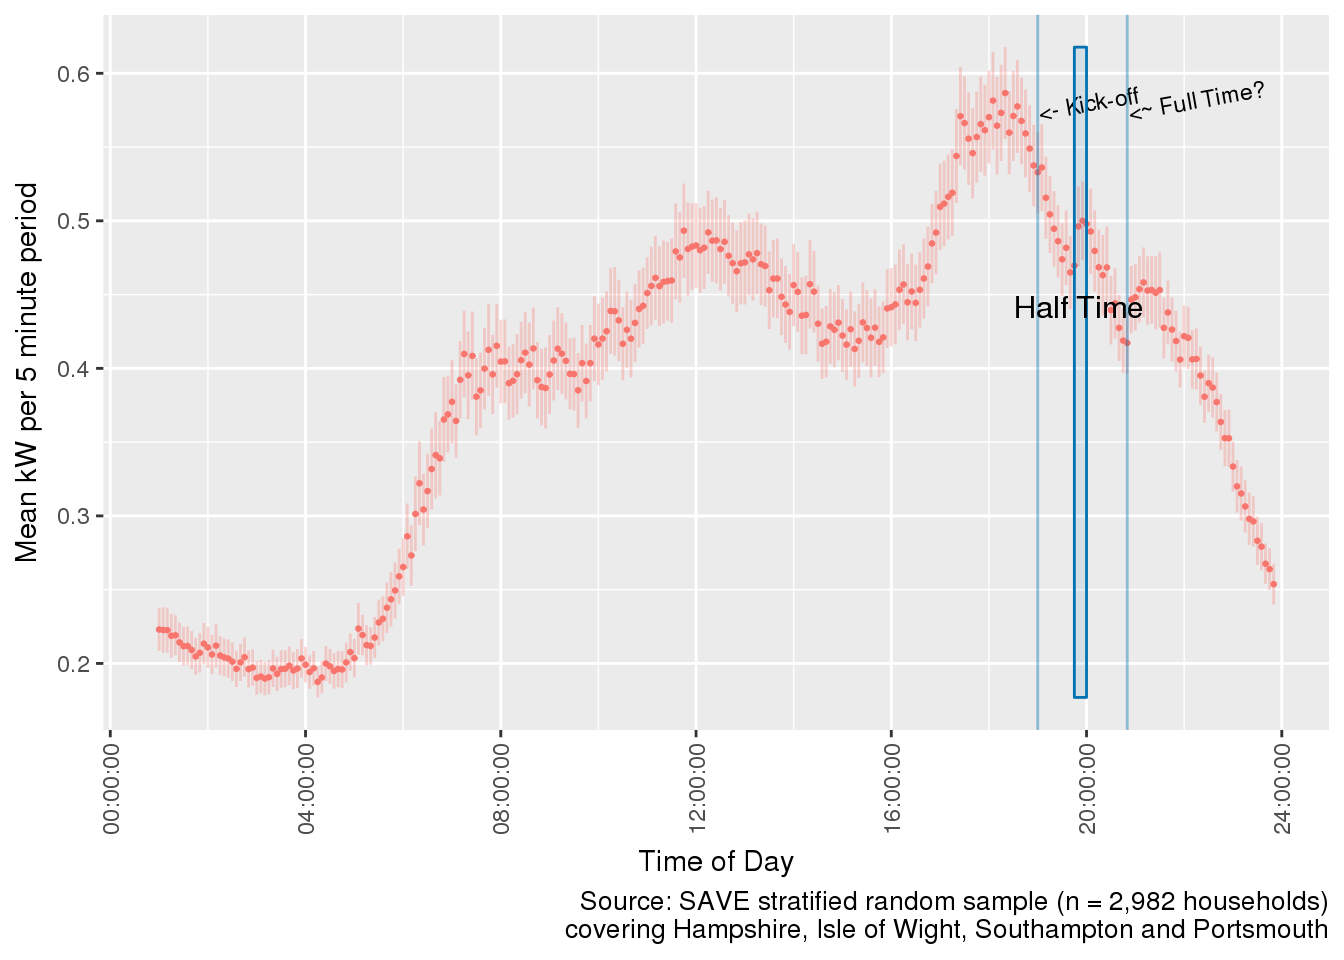 This pattern looks like just another weekday except for the rather odd lack of a morning peak. In fact the whole day looks rather like a Sunday except for the notable wobbles around 19:00 – 21:00 associated with the game.
There were a number of ‘surge’ events during the day of which one is clearly associated with half-time in the football, as is full-time although the latter is not as large as the trend is already upwards.
To calculate the population level surge for comparison with National Grid’s forecast we assume that there are 27 million UK households (ONS) and that the SAVE sample is broadly representative of the UK population. Simple multiplication suggests a surge value of ~722 MW at 19:45 – 19:50 compared to National Grid’s forecast of 500 MW. However if we reduce the population to just England (23 m households who may have been slightly more interested in the result…) then we get an estimated surge value of ~602 MW at 19:45 – 19:50.
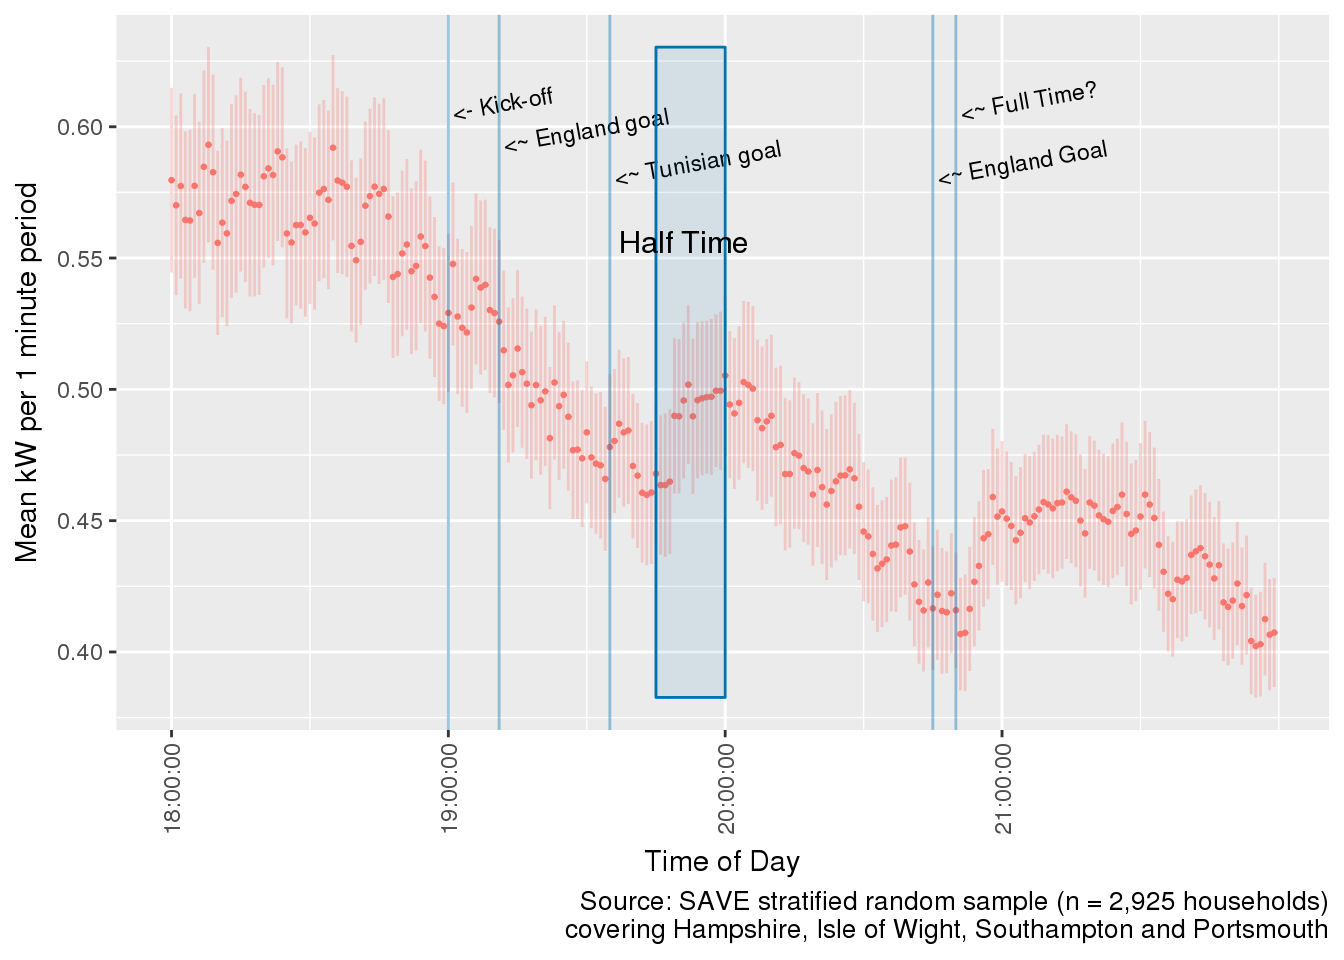 The 1 minute level data (left) shows more clearly that the half-time surge is slightly delayed after 19:45 and it also shows a small surge around kick-off and also around the time of the Tunisian goal.
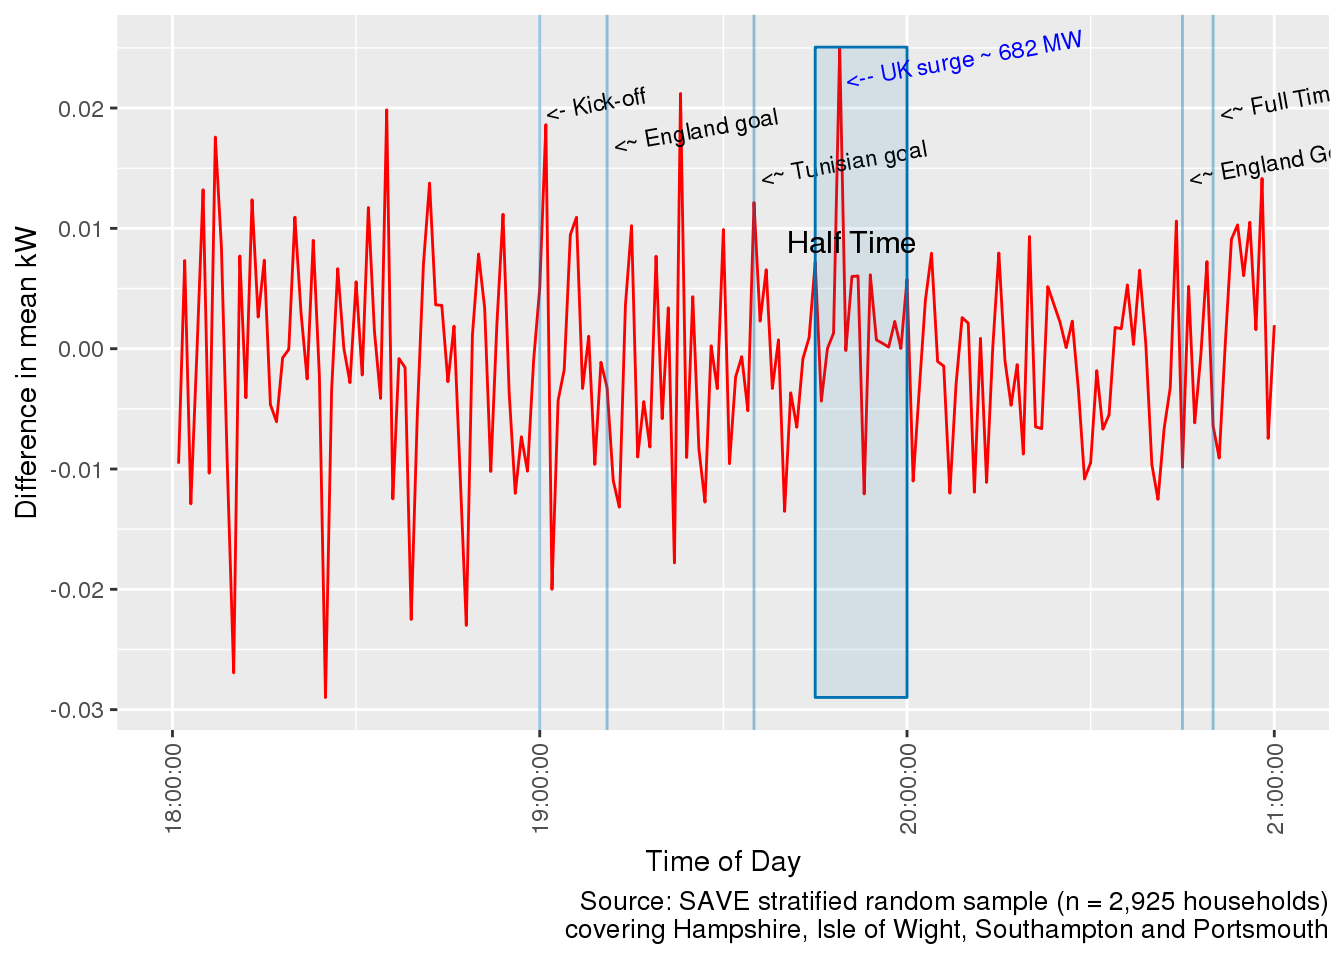
Plotting the minute by minute lagged difference in mean kW (below) suggests that there were a number of ‘surge’ events of which one is clearly associated with kick-off, one with the Tunisian goal and one with half-time. As noted, the full-time surge is not as instantaneous as the trend is already upwards. In this case, using the same method we estimate a maximum surge value of ~682 MW for the whole of the UK at 19:49:00 or ~569 MW for England. Either way this was a ~5.4% pick-up in household demand.
 In both cases our estimates of the surge seen are somewhat larger than those forecast by the National Grid although the confidence intervals plotted in the first chart should remind us that neither of our estimates are exact. Why might there be differences?
- There was a bigger pick-up than National Grid expected – did they assume, for example, that only the 23m English fridges would be opened?!;
- The SAVE sample is not representative of the UK household population;
- We are using slightly different aggregation scales (5 minutes and 1 minute) to the National Grid;
- We are only measuring households not pubs or other ‘public’ viewng locations which will probably see additional surges;
- All of the above. My money’s on this one…
Update
 National Grid reported a pick-up of 600 MW which falls right in between our ~682 MW estimate for the UK as a whole and ~569 MW for England based on the 1 minute level data but pretty much bang on our ~602 MW estimate for England using the 5 minute data.
We don’t (yet) know the basis for the NG calculation but this suggests that our quick-and-dirty estimates using the SAVE household sample are broadly accurate for England at least.
Perhaps the SAVE sample’s football-watching habits are replicated across most of England if not necessarily the UK…